Do you know how to open up your v tune data and view and replay the histogram? What you do, like I just did to view your data runs, is to open up the file. Then click 'view'. Then click 'v tune histogram'. Once you click that, another box opens. This is the Histogram Screen. Hit 'Start" and watch that play out. The very light green squares are the squares that you have collected the minimum amount of data that is satisfactory for the TTS software. Make sure that the vertical line in the graph is all the way to the left., BTW.
Quick question... do you have TTS2 with the blue dongle? Or TTS with the black dongle? If you have the blue? Are you using flight recorder to save the data? Or... are you carrying around a laptop while you ride? I will have some advice depending on how you collect data.
OK... back to the histogram. You can click on any square (when the recording is finished) and see how many 'hits' are in each cell, and also how much MAP was recorded in KPAs.
What I see right now? You are not collecting enough data.
Here is what I mean.
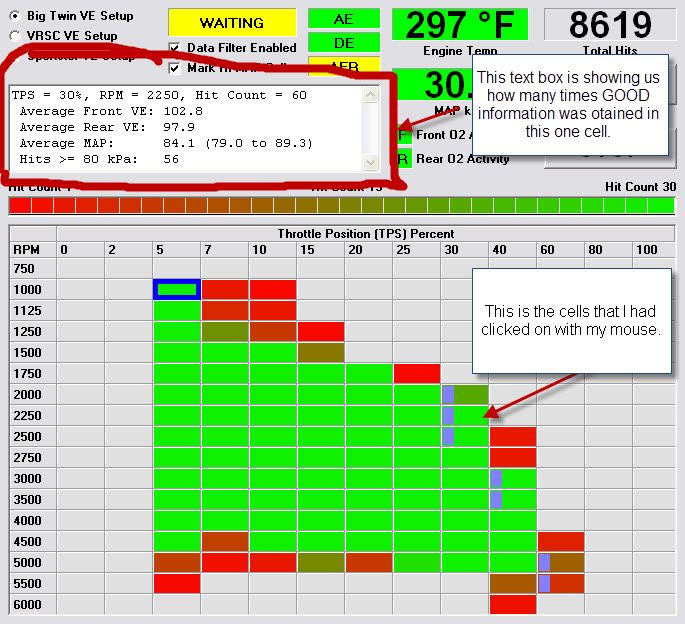
Looking at yours, you did not collect enough data and... it is hard to do so, right out of the box. The easiest thing to do is ride a little, and try to target ONE section very well. Pull over, look at laptop and SEE if you did. Adjust thee riding style until you CAN hit the targets you wish. Data collecting is the KING of this whole 'tuning' deal.
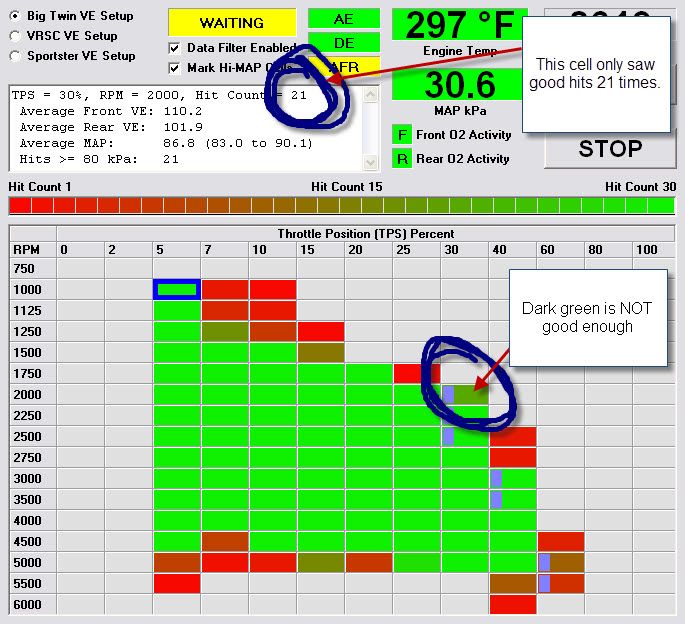
What you need to start accomplishing the ability to get 'purple squares' like this.
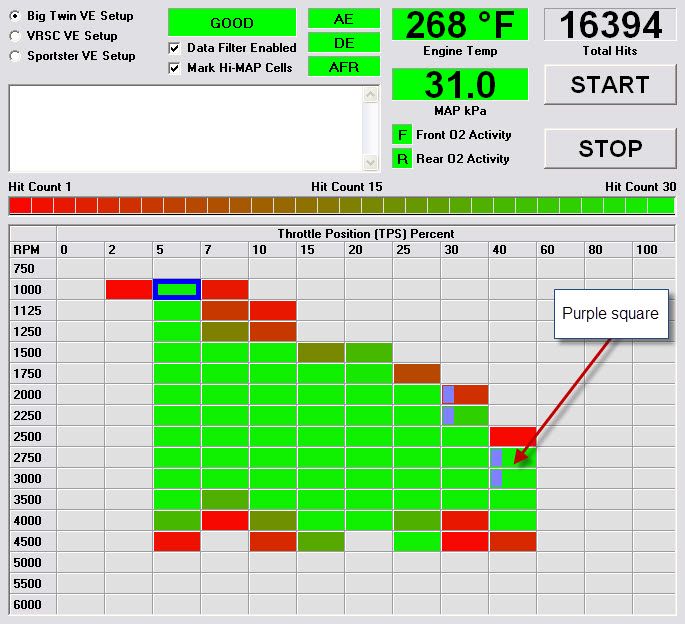
What this means is you have collected enough data to satisfy TTS that you have hit 80 KPA in each row you can.
Now... to piss you off... here is a really good data recording. I cheated and did this on a dyno. But you get the idea.
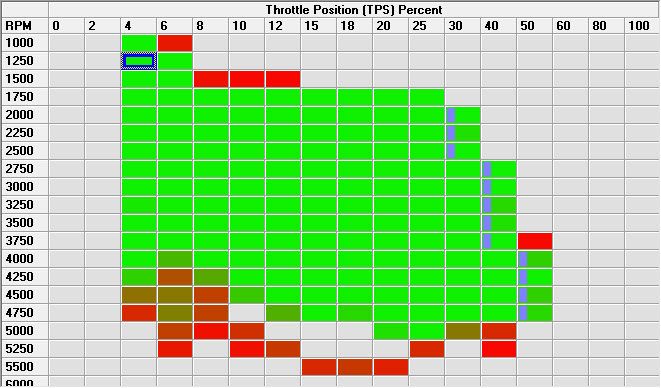
So, work on data collection. ( I have posted TPS data for you to see, except this is DBW and it doesn't collect below 4%, where you have a cable and you collect at 0%). Lambda Histograms look like a green brick. TPS kind of misses the top right and bottom left, which is fine.
Then when making your tunes from the data recorded... you have a box that says accept of not. It shows colors that represent the amount of change from a previous run(s). THIS box fools most people when they start to learn about data collecting.
Most will see a whole bunch of white areas and feel that there data is really good in those spots. nothing could be further from the truth! What is usually happening is we all miss areas when collecting data, and if we miss the same area over-and-over... it will show white, which actually means... yes, there hasn't been changes, but the true reason there are no changes is because no data has NEVER been collected. The software does not differentiate this. This acceptance change of VE box must always be viewed along with a histogram. WIth the histogram, you could see if ANY data has ever been collected, or it was a spot that has been skipped over and over.
Once we get you better at collecting data... I can see you have some EGR issues. But FIRST, learning proper data collection is whats happening.
Even on the dyno, I do NOT bother to collect data above 4500 rpms. Hopefully. there should be some really nice steep long hills that you can run up. Using hills and 5th gear or maybe 4th. climb the hill around 2500 rpms and then see if you got the purple check marks. To hit 80 kpa... it takes a load on the engine. It just takes some practice, my Friend.
Oh... you will see in some of my data collecting that I am near 300*F. That was me playing with timing, etc. YOU will want the bike at 260ish* to v-tune with. Also, it's best to collect data at above 200- or so.
And... Once you kind of get data collection better, we can work on idle and sub idle tuning. I ALWAYS get all the VEs I can BELOW 2000 rpms. But... the 2000 row and 2250 rows need to have the VEs nice and solid, first.
__________________


 Author
Topic: 2014 CVO Limited TTS Tuning (Read 3409 times)
Author
Topic: 2014 CVO Limited TTS Tuning (Read 3409 times)